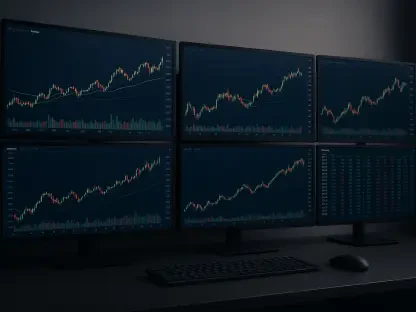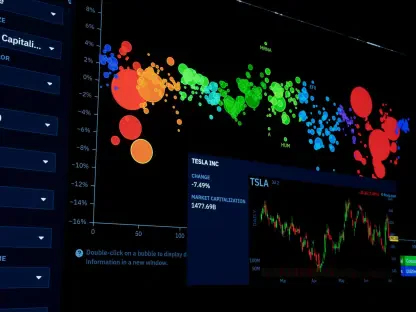

The platform’s evolution from a simple web tool into a comprehensive financial ecosystem reflects the growing demand for accessible high-level quantitative analysis. In the current landscape of 2026, financial technology has reached a point where the barrier between retail investors and institutional analysts has almost entirely dissolved. TradingView stands at the center of this transformation, serving over 100 million users who require real-time insights across an increasingly complex array of global assets. This growth is not merely a result of its aesthetic appeal but stems from its ability to consolidate stocks, cryptocurrencies, forex, and commodities into a single, fluid interface that operates seamlessly across all modern devices. As market volatility remains a constant factor in global economies, the necessity for a centralized analytical hub has moved from being a luxury to a fundamental requirement for any serious market participant. The platform’s commitment to low-latency data and high-fidelity visualization has solidified its position as the primary window into the world’s financial movements, fostering a culture of data-driven decision-making that spans across continents and asset classes.
Advanced Visual Analytics: Beyond Standard Charting
The charting engine remains the cornerstone of the user experience, currently recognized as the industry standard for clarity and technical depth. Traders in 2026 have access to a library of over 400 native technical indicators, ranging from foundational moving averages to advanced algorithmic oscillators like the updated RSI and MACD. The flexibility of the interface allows for the implementation of diverse charting styles, such as Renko, Kagi, and Heikin Ashi, which are essential for filtering out market noise during periods of high turbulence. This visual versatility ensures that whether a user is a scalp trader looking at one-minute intervals or a long-term investor analyzing monthly trends, the data remains legible and actionable. The precision of the drawing tools, including automated Fibonacci retracements and Gann fans, allows for a level of technical mapping that provides a significant edge in identifying potential support and resistance zones before they are reached by price action.
Furthermore, the platform has refined its multi-asset comparison tools to meet the needs of a more interconnected global economy. Users can effortlessly overlay different symbols, such as comparing the performance of Bitcoin against the price of Gold or the S&P 500, to pinpoint shifting market correlations. This functionality is crucial in the current era, where traditional and digital assets frequently influence one another in ways that were previously unpredictable. By providing a side-by-side or overlaid view of these instruments, the platform enables a holistic approach to market analysis that accounts for broader macroeconomic trends rather than viewing assets in isolation. The ability to sync multiple charts across different tabs and devices ensures that a trader’s workspace remains consistent, allowing for a smooth transition from a multi-monitor desktop setup to a mobile environment without losing any analytical context or saved configurations.
Quantitative Research: The Pine Script Ecosystem
The introduction of Pine Script version 6.0 has elevated the platform from a visualization tool to a powerhouse for quantitative research and strategy development. This proprietary, lightweight programming language allows users to create their own indicators and automate complex trading strategies with minimal coding experience compared to traditional languages like C++ or Python. The current iteration of the script provides enhanced backtesting capabilities, allowing traders to simulate how their strategies would have performed against historical data with incredible precision. This process includes detailed reporting on drawdowns, profit factors, and win rates, which are vital metrics for assessing risk before any real capital is deployed. For the growing community of quant-focused investors, these tools offer a way to validate hypotheses and refine entry and exit points through a rigorous, data-centric methodology that removes much of the emotional bias often associated with manual trading.
In addition to individual script development, the platform hosts an expansive community library that now contains over 100,000 open-source scripts. This repository functions as a massive collaborative laboratory where traders and developers from around the world share their most innovative tools. This democratization of high-level technology means that a user without any programming knowledge can still benefit from sophisticated momentum indicators, liquidity trackers, and volume profile tools created by expert developers. The collaborative nature of this ecosystem fosters continuous innovation, as scripts are frequently updated, forked, and improved by the community at large. This cycle of peer-to-review and collective improvement ensures that the tools available to users are always at the cutting edge of technical analysis, reflecting the most current understanding of market dynamics and mathematical modeling in the 2026 financial landscape.
Market Intelligence: Screening and Simulation Tools
To navigate the vast amount of information generated by global markets, the platform provides a highly sophisticated screening engine designed for stocks, forex, and digital assets. These screeners are not limited to basic price filters; they allow users to sort through thousands of instruments based on complex technical conditions and fundamental health. For instance, an equity investor can search for companies with a specific price-to-earnings ratio that also exhibit a bullish crossover on a 200-day moving average. This dual-layered approach to screening ensures that users can find opportunities that meet both their value-based criteria and their technical timing requirements. The global reach of these tools is particularly impressive, as they pull data from exchanges in Europe, Asia, and the Americas, providing a truly international perspective that is essential for diversification in a modern investment portfolio.
For those looking to sharpen their skills without the immediate pressure of financial loss, the paper trading simulator provides a high-fidelity environment for practice. This tool utilizes real-time market data to allow users to execute trades and manage positions exactly as they would in a live account. It is an invaluable resource for testing new strategies or for beginners to gain a feel for market rhythm and execution speed. While the simulator is remarkably accurate in replicating the mechanics of trading, the platform includes educational materials that remind users of the psychological differences between virtual and live environments. The presence of these practice tools highlights the commitment to user education, ensuring that market participants are well-prepared before they engage with live liquidity. By bridging the gap between theoretical knowledge and practical execution, the platform serves as both an educational academy and a professional-grade execution terminal.
Social Connectivity: Sentiment and Collaborative Analysis
One of the most defining characteristics of the platform is its integration of social networking features that allow for a global exchange of market perspectives. The public ideas feed serves as a constant stream of charts, predictions, and educational content published by users ranging from amateur enthusiasts to veteran professionals. This social layer transforms the solitary act of trading into a collaborative experience where ideas are scrutinized, debated, and refined in real time. Traders can follow specific analysts whose methodologies align with their own, receiving notifications whenever new insights are shared. This peer-review system is further bolstered by a reputation mechanism that highlights contributors who consistently provide high-quality, accurate analysis. This helps users filter through the noise and focus on the most credible voices within the community, although the platform maintains a strong emphasis on the importance of independent due diligence.
Beyond the public feed, the platform offers dedicated chat rooms for specific asset classes and regions, allowing for immediate discussion of breaking news or sudden price movements. These rooms are often the first place where market sentiment shifts are visible, as traders react to geopolitical events or corporate earnings in a collective forum. While these social features provide a wealth of information, they also require a disciplined approach to avoid the pitfalls of herd mentality. The most successful users treat the social aspect as a source of alternative data and sentiment analysis rather than a direct signal for execution. This balance between community engagement and individual responsibility is a hallmark of the user culture, encouraging a more informed and skeptical approach to market forecasting. The synergy between the technical tools and the social environment creates a unique feedback loop that accelerates the learning curve for everyone involved.
Pricing Structures: Navigating the 2026 Tiered Model
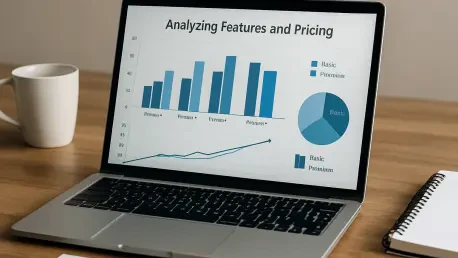
The platform continues to operate under a freemium model designed to provide value at every level of experience, starting with the Basic plan. This free tier is intended for those who are just beginning to explore technical analysis, offering a single chart per tab and a limited number of indicators. While it serves as an excellent introduction, most active participants quickly find themselves migrating to one of the paid subscriptions to unlock more advanced features. The Essential plan, currently priced at approximately $14.95 per month, is the most common entry point for retail traders. It increases the number of indicators per chart and provides access to more alerts, which are critical for monitoring price action across multiple symbols without being glued to the screen. This tier strikes a balance between affordability and functionality, making it the preferred choice for those who are serious about their market involvement but do not yet require institutional-level data depth.
For those with more demanding workflows, the Plus and Premium plans offer significant upgrades in terms of data capacity and analytical power. These tiers are characterized by their ability to handle a higher volume of historical data bars, which is essential for long-term backtesting and in-depth historical research. They also allow for more charts to be displayed simultaneously in a single window, a feature highly valued by day traders who need to monitor multiple timeframes or correlated assets at once. At the top of the hierarchy is the Ultimate plan, which is tailored for professional-grade requirements. This tier provides the maximum number of indicators, alerts, and historical data points available on the platform, alongside priority customer support. While the cost of these higher tiers is a significant consideration, the efficiency and competitive advantage they provide often justify the expense for those who manage large portfolios or trade professionally.
Market DatUnderstanding the Cost of Real-Time Information
A critical aspect of the platform’s cost structure that users must understand is the distinction between software subscriptions and market data fees. While the platform provides delayed data for the majority of global markets at no additional charge, those who require real-time, second-by-second accuracy must pay separate fees for specific exchanges. For example, accessing live data from the NASDAQ or the NYSE involves a monthly fee that is passed directly from the exchange to the end-user. These costs are not unique to this platform but are a standard requirement across the financial industry for professional-grade setups. For day traders, scalpers, and anyone relying on rapid execution, these additional fees are an unavoidable part of the cost of doing business, ensuring that the price on the screen is identical to the price on the exchange floor.
These data fees are segmented by region and asset class, allowing users to customize their subscriptions based only on the markets they actually trade. A trader focusing exclusively on European equities can opt for data from the LSE or Euronext without paying for North American or Asian exchange access. This modular approach helps in managing monthly expenses, especially for specialized traders who do not need a global data feed. It is also important to note that many brokers who integrate with the platform allow users to utilize their existing data subscriptions, potentially reducing the overall cost. However, for those who use the platform primarily as a research tool independent of their brokerage, factoring in these exchange fees is essential for an accurate budget. The transparency regarding these costs ensures that there are no surprises, but it does mean that a truly “professional” setup involves more than just the base subscription price.
Competitive Landscape: TradingView Versus Specialized Platforms
In the competitive arena of 2026, the platform maintains a distinct advantage through its modern user interface and cross-asset versatility, though specialized competitors still hold ground in specific niches. For instance, platforms like ThinkOrSwim continue to be favored by high-volume options traders in the United States who require deep analytical tools for complex multi-leg strategies and the Greeks. While TradingView has made strides in options visualization, it is often viewed as a more generalist tool compared to the deep, mathematics-heavy focus of specialized brokerage software. However, for the vast majority of traders who value a clean, intuitive design and the ability to switch between crypto, stocks, and forex in a single click, this platform remains the unrivaled leader. The browser-based nature of the software also provides a significant accessibility advantage over traditional platforms that require heavy desktop installations.
When compared to the MetaTrader ecosystem, which remains the dominant force in the forex and automated HFT space, the distinction becomes even clearer. MetaTrader is built for execution and high-speed algorithmic bots, often at the expense of a modern or user-friendly interface. TradingView, by contrast, is a “research-first” platform that has only recently begun to close the gap in broker integration and automated execution. While many forex brokers now offer direct integration, allowing for trade execution from the charts, those focused strictly on high-frequency latency-sensitive strategies may still find MetaTrader’s local execution more suited to their needs. Despite this, the gap is closing rapidly as more liquidity providers and brokers recognize the demand for the superior charting and social capabilities that only a web-native, community-driven platform can provide to a global audience.
Identifying Challenges: Support and Integration Gaps
Despite the overwhelming success and feature density of the platform, certain limitations continue to be a point of contention for the user base in 2026. The most prominent issue often cited is the speed and accessibility of customer support, particularly for those on the lower pricing tiers. Due to the massive scale of the global user base, obtaining personalized assistance for billing or technical glitches can sometimes be a slow process, often relying on a ticket-based system that may take several days for a resolution. This can be frustrating for professional traders whose livelihoods depend on the constant availability of their analytical tools. While the Premium and Ultimate tiers offer improved support response times, the disparity in service levels remains a notable drawback for the broader community of retail users who expect more immediate assistance in the digital age.
Another area where the platform faces challenges is the consistency of its broker integrations across different global regions. While many major international brokers have established seamless connections, allowing for direct trading from the charts, the experience is not uniform. Users in certain jurisdictions or those using smaller, local brokers may find that the integration is either limited or non-existent, forcing them to use the platform for research while executing trades on a separate application. Additionally, while the tools for standard equity and crypto trading are world-class, the functionality for complex, multi-leg options strategies and futures spread trading still lags behind more specialized institutional software. These gaps indicate that while the platform is a master of visual analysis and social intelligence, it still has room to grow in its transition to becoming a truly all-in-one execution terminal for every possible financial instrument.
Professional Strategies: Maximizing Platform Utility
The most successful market participants over the past several months recognized that the platform’s value was best extracted through a combination of automated alerts and multi-timeframe analysis. They utilized the Ultimate plan to maintain high-density data feeds that allowed for the identification of institutional order blocks across multiple continents simultaneously. By integrating Pine Script 6.0 with external webhooks, these traders were able to bridge the gap between analysis and execution, ensuring that their strategies were implemented with minimal latency even when they were away from their desks. This transition from manual charting to a more systematic, automated approach was a common theme among those who maintained profitability during the recent market shifts. They found that the ability to backtest ideas against decades of historical data provided a psychological buffer against the inherent uncertainty of live trading environments.
Moving forward, participants determined that the most effective way to utilize the social features was as a contrarian indicator or a source of diversified perspectives rather than a primary signal. They engaged with the community to challenge their own biases, often seeking out analysts with opposing views to stress-test their investment theses. This disciplined use of the social layer, combined with a rigorous application of the screening tools, allowed for a more robust risk management framework. As the financial landscape of 2026 continues to evolve, the platform has proven that its true strength lies in its adaptability and the collective intelligence of its users. The next step for any serious investor involved a deep dive into custom script development and the optimization of their data subscriptions to ensure they were not overpaying for unnecessary exchange access while still maintaining the real-time edge required for modern market success.